
Published: June 2026
Headlines
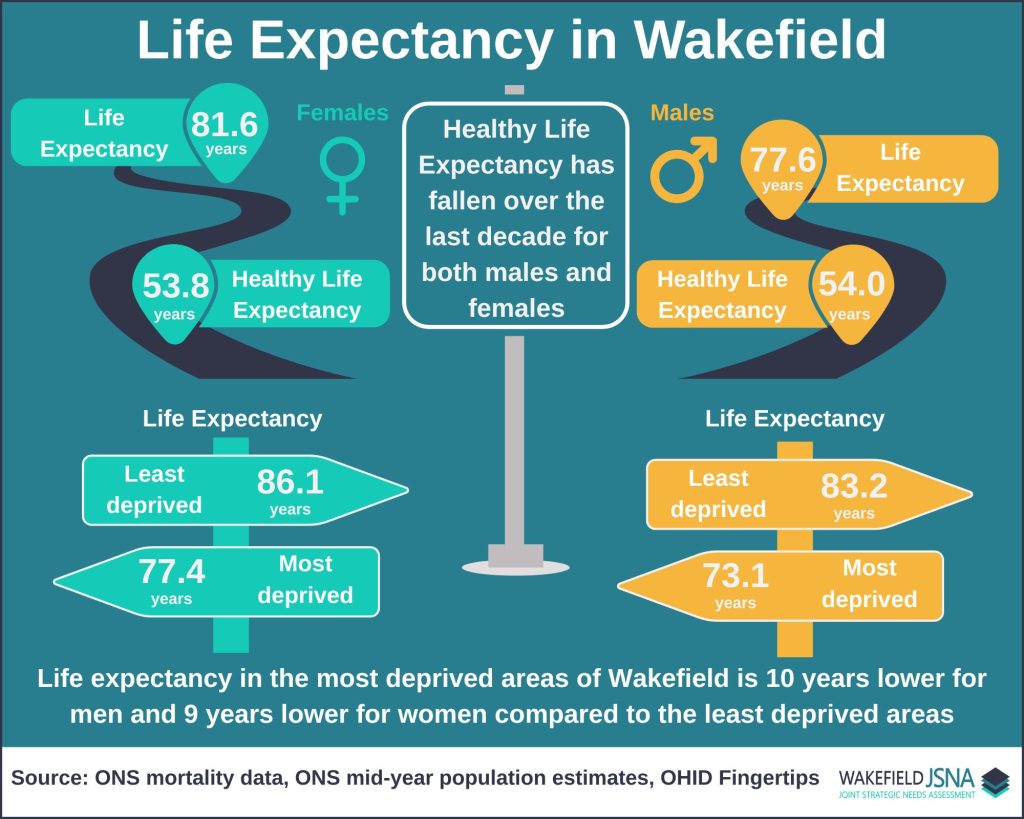
- Healthy life expectancy has fallen for both males and females over the last decade. In Wakefield, healthy life expectancy at birth for females is 53.8 years, and for males is 54.0 years (2022-2024), a decline of 6 years for females and 5.3 years for males since 2012-14.
- In Wakefield, female life expectancy at birth is 81.6 years compared to 77.6 years for males
- Life expectancy at birth is significantly lower for males and females living in the most deprived areas of the district compared to the district average. Males living in the most deprived areas of the Wakefield district can expect to live around 10.1 years fewer than those in the least deprived areas. For females this difference is around 8.7 years
- There has been no real change in life expectancy since 2012, with levels declining during the Covid-19 pandemic. Life expectancy at birth in Wakefield has almost returned to pre-pandemic levels
- Wakefield has significantly lower levels of life expectancy at birth and healthy life expectancy at birth compared to national and regional levels for both males and females
The national picture and how Wakefield compares…
This section contains the latest nationally published data from The Office for Health Improvement and Disparities (OHID) Fingertips public health profiles Public Health Outcomes Framework – Data | Fingertips | Life Expectancy, which includes data and analysis for a number of different life expectancy indicators.
The following interactive dashboard provides a summary of the Fingertips life expectancy indicators and can be used to explore how Wakefield compares to national and regional figures. Click on the buttons at the top to navigate between the different page themes. Select an indicator URL to open the relevant page within the OHID profiles, where further details and analysis are available.
Please note: some of the figures in the above dashboard differ slightly to the local analysis dashboards as the local analysis has used more recent population estimates for the population base compared to Fingertips
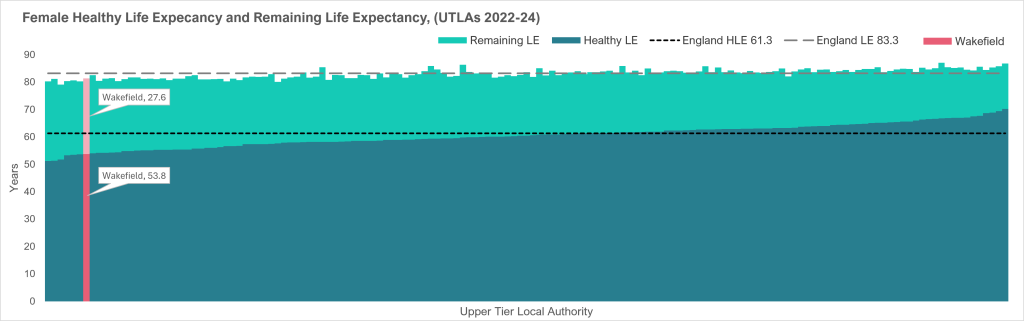
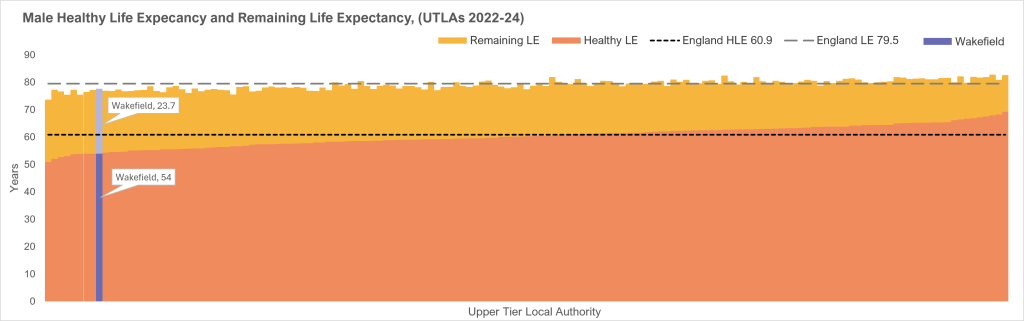
Healthy life expectancy is the average number of years a person would expect to live in good health, based on current mortality rates and levels of self-reported good health, and is a key measure of the population’s health. Over the decade 2012–14 to 2022–24, healthy life expectancy for males and females has fallen, with the vast majority of local areas seeing a decline. Healthy life expectancy is below the state pension age of 66 years in more than 90% of local areas in the UK, and more than 1 in 10 local areas have a healthy life expectancy below 55 years [4]. In Wakefield (2022-24) healthy life expectancy for males is 54.0 years (England 60.9 years), for females it is 53.8 years (England 61.3 years), a decline of 5.3 years for males and 6 years for females since 2012-14 [1]. Healthy life expectancy is strongly associated with deprivation and Wakefield District is one of the most deprived 20% local authorities in England. The latest ONS data [5] shows a gap of around 20 years between the most and least deprived deciles in England (19.4 years for males and 20.3 for females). This gap has widened since 2013–15 when it was 18.3 years for males and 19.1 years for females. While healthy life expectancy declined across all deciles between 2013–15 and 2022–24, the largest falls have predominantly been in the most deprived deciles, indicating that outcomes have deteriorated more rapidly in these areas [4]. With life expectancy remaining largely stable, and declines in healthy life expectancy, the years someone can expect to live in poorer health are increasing. In Wakefield, the years someone can expect to live in poorer health is 23.7 years for males and 27.6 years for females (England: males 18.6 years, females 22.0 years). Relative to 150 other Upper Tier Local Authorities (UTLAs) in England, where healthy life expectancy could be calculated, Wakefield ranked 7th lowest for females and 9th lowest for males.
Healthy Life Expectancy
Headlines
Life expectancy at birth for males and females in England increased steadily between 2000 and 2012-14, then remained static until 2017-19, a trend also seen regionally and locally [1], [2]. The impact of the Covid-19 pandemic is reflected from 2020 where life expectancy at birth decreased. Figures are still below pre-pandemic levels for many local areas [2], [3], with life expectancy at birth in Wakefield almost in line with pre-pandemic levels [1]. Across England, there continues to be sizeable regional differences in life expectancy at birth [3].
Life Expectancy
Headlines
What are the differences within Wakefield district?
This section calculates life expectancy at a local Wakefield level using mortality data from the Primary Care Mortality Database supplied by ONS and population data from ONS mid-year population estimates. In Wakefield district, 2023-2025: The following interactive dashboard can be used to explore variation in life expectancy by different breakdowns. Click on the buttons at the top to navigate between the different demographic breakdowns. Please note: some of the figures in the above dashboard differ slightly to the Fingertips dashboard as the local analysis has used more recent population estimates for the population base compared to FingertipsInequalities
This section calculates life expectancy at a local Wakefield level using mortality data from the Primary Care Mortality Database supplied by ONS and population data from ONS mid-year population estimates. Over the last decade: The following interactive dashboard can be used to explore trends in life expectancy by different breakdowns. Click on the buttons at the top to navigate between the different demographic breakdowns. Please note: some of the figures in the above dashboard differ slightly to the Fingertips dashboard as the local analysis has used more recent population estimates for the population base compared to FingertipsTrends
References
- Public Health Outcomes Framework – Data | Fingertips | Life Expectancy – OHID Fingertips profile bringing together data on Life Expectancy by country, region and local authority.
- Health Trends: Life expectancy in Yorkshire and the Humber – Health trends intelligence in England summarising key information about the health of people nationally and by region and how it has changed over time. It is intended to provide an overview for the public in an accessible way.
- Life expectancy for local areas of the UK – Office for National Statistics – Statistical bulletin from the ONS detailing subnational trends in life expectancy for local areas of the UK: between 2001 to 2003 and 2022 to 2024.
- Healthy life expectancy trends in the UK: a watershed moment – The Health Foundation
- Healthy life expectancy by national area deprivation, England and Wales – Office for National Statistics – Statistical bulletin from the ONS detailing life expectancy and years expected to live in “good” health by deprivation level in England and Wales. Includes estimates of life expectancy between 2011 to 2013 and 2022 to 2024.
Further information and resources
- OHID: Health of the Region tool – Health intelligence pack for health improvement.
- Health Inequalities Dashboard – tool developed to present evidence of health inequalities in England. Measures of inequality are provided for key indicators to monitor progress on reducing inequalities within England. For some indicators, inequality measures are also provided within regions, and upper tier local authorities.
- Healthy life expectancy, UK – Office for National Statistics – Statistical bulletin from the ONS detailing healthy life expectancy for the UK, including subnational areas: between 2011 to 2013 and 2022 to 2024. Healthy life expectancy is the number of years people are expected to spend in “good” general health in the UK.