
Published: November 2025 | Updated: January 2026.
Populations quoted on this page are calculated using ONS mid-2024 population estimates.
Headlines
The English Indices of Deprivation 2025 (IoD25) were released on 30 October 2025. This page summarises the position for Wakefield District as a whole, and the differences between areas within the district.
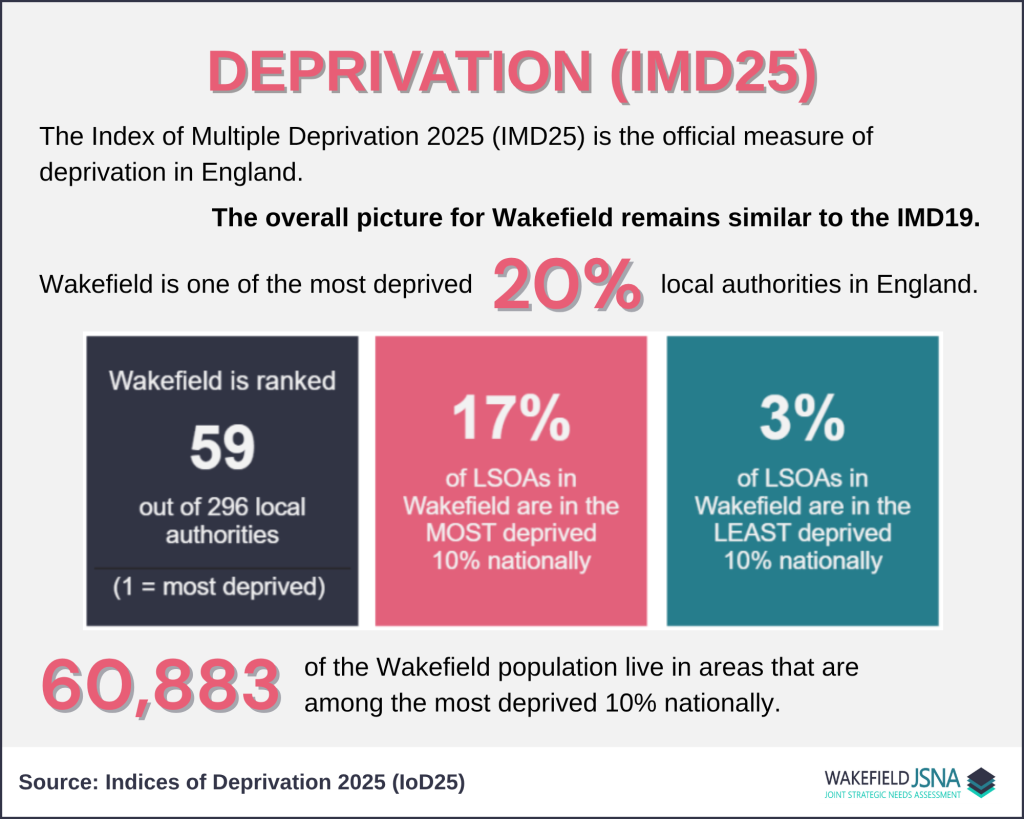
- The overall picture for Wakefield remains similar to the IMD19.
- Wakefield District is one of the most deprived 20% local authorities in England, with a rank of 59 out of 296 (1 = most deprived).
- 32 out of 215 Lower-layer Super Output Areas (LSOAs) in Wakefield District have remained in the most deprived 10% nationally between IMD19 and IMD25.
- 63,393 (17.2%) of the Wakefield population live in areas that are among the most deprived 10% nationally.
- 3% of LSOAs in Wakefield are in the least deprived 10% nationally, in which 13,681 of the Wakefield population live.
- New datasets, methodologies and geographies have been used to produce the IoD25, meaning outputs are less directly comparable to previous Indices.
- 55 indicators comprise the IoD25, an increase from 39 in the IoD19. Of these, 20 are new indicators, 14 indicators have been significantly modified, three indicators have been removed.
Deprivation ≠ Poverty
It is important to note that deprivation is not the same as poverty. Deprivation refers to a general lack of resources and opportunities, whereas poverty only refers to a lack of financial resources.
Deprivation – lack of resources and opportunities of all kinds
Poverty – lack of resources related to finances
Index of Multiple Deprivation (IMD) 2025
- The English Indices of Deprivation (IoD25) measure relative levels of deprivation in 33,755 small areas or neighbourhoods, called Lower-layer Super Output Areas (LSOAs), in England.
- New datasets, methodologies and geographies have been used to produce the IoD25, meaning outputs are less directly comparable to previous Indices.
- The IoD25 suite of resources comprises of 7 standalone indexes which are combined and weighted together to form the Index of Multiple Deprivation 2025 (IMD25) – the official measure of deprivation in England.
- LSOAs are then ranked according to their scores and assigned an IMD25 decile.
What is a decile?
Decile is the term used when data is divided into ten equal groups.
In this instance, the most deprived 10% LSOAs are classed as 'decile 1' and the least deprived 10% areas 'decile 10'.
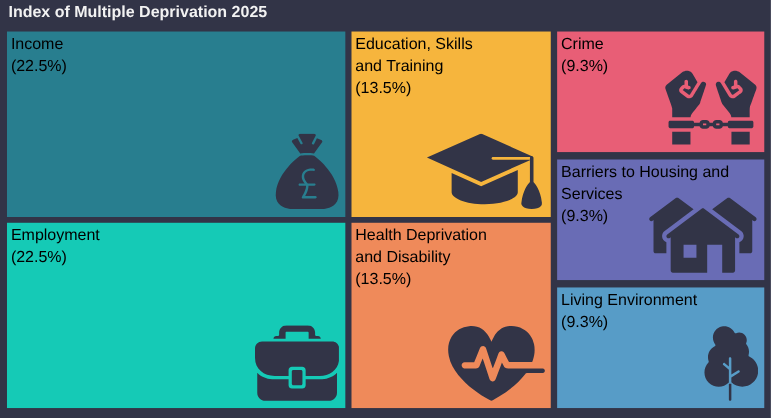
The 7 indexes (or domains) that are included in the IMD25 are listed below. These are weighted according to the percentages shown, with ‘Income’ and ‘Employment’ having the greatest impact on the overall score. More information about the index can be found on the website: English indices of deprivation 2025 – GOV.UK.
How does Wakefield compare nationally?
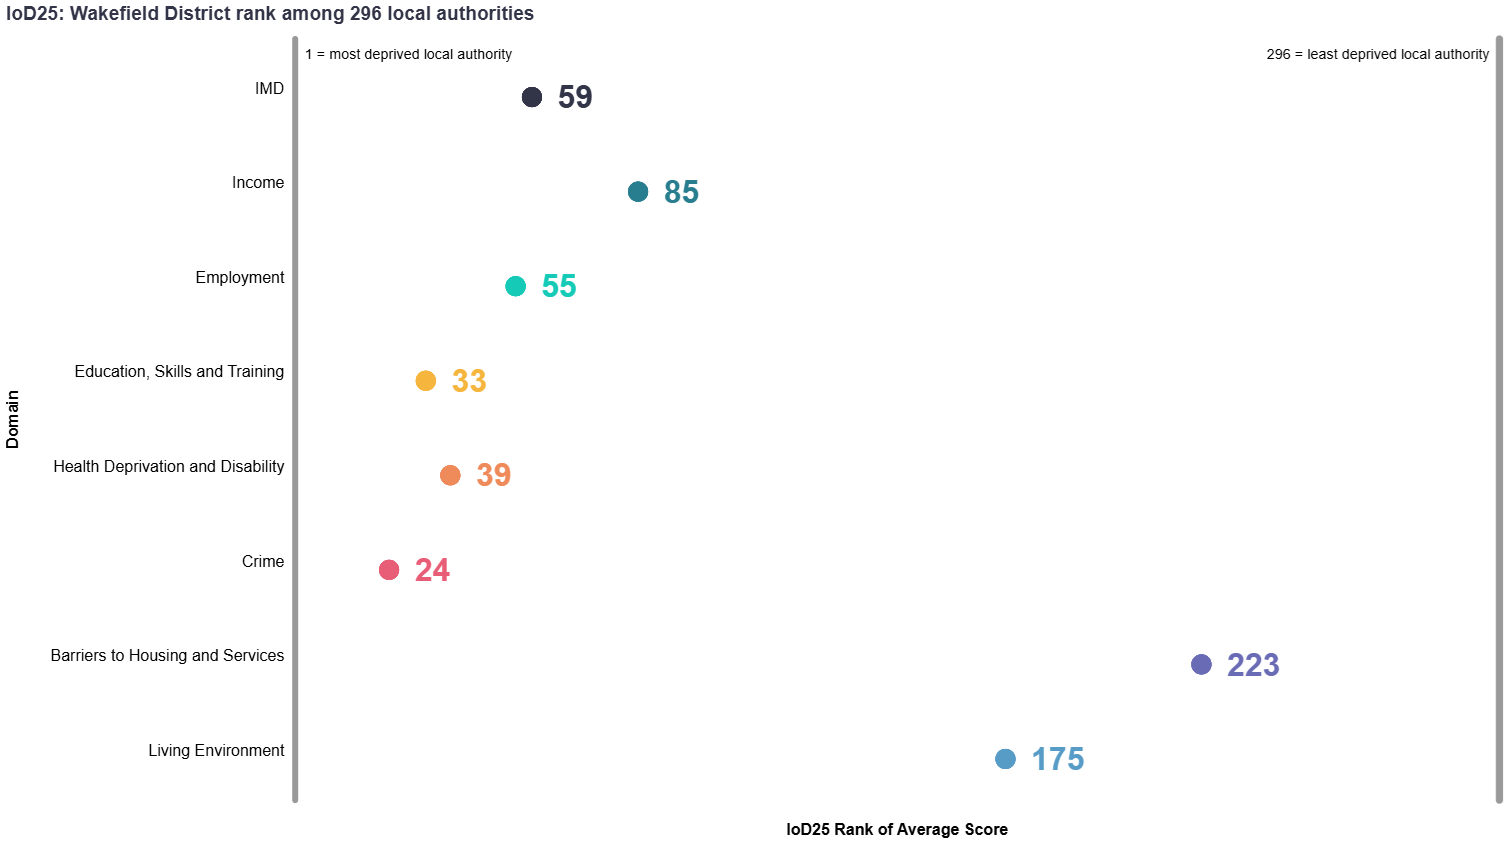
IMD25 is calculated at LSOA level. Taking an average of the LSOA scores within a local authority gives an indicative deprivation score per district. These can then be ranked to give each local authority a rank of average score value.
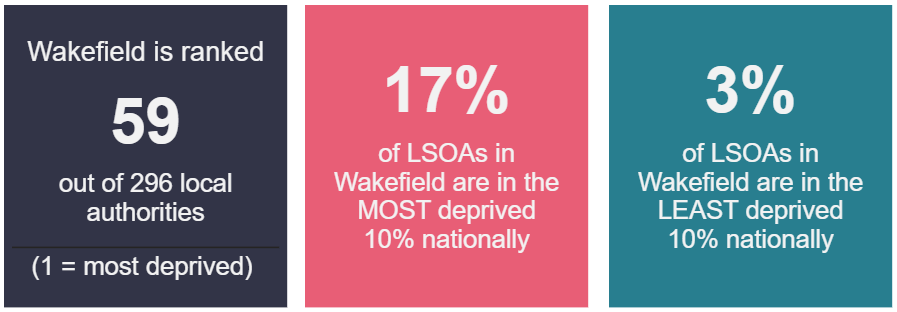
- Wakefield District is in the most deprived 20% local authorities in England, with a rank of 59 out of 296 local authorities, with 1 being the most deprived.
- 63,393 people live in the 17% of LSOAs in Wakefield are in the most deprived 10% nationally.
- 3% of LSOAs in Wakefield are in the least deprived 10% nationally, in which 13,681 people live.
The main drivers for the deprivation score in Wakefield are the ‘Crime’, ‘Education, Skills and Training’ and ‘Health Deprivation and Disability’ domains, in which Wakefield ranks 24, 33 and 39 respectively.
How has Wakefield’s position changed since IMD19?
Wakefield District’s relative deprivation rank has improved slightly from the IMD19 publication (ranked 54 in 2019 to ranked 59 in 2025), however the methodology has significantly changed meaning outputs are less directly comparable to previous indices.
Overall, a total of 55 indicators comprise the IoD25, an increase from 39 in the IoD19. Of these, 20 are new indicators, 14 indicators have been significantly modified, while 21 have been updated to more recent timepoints. Three indicators have also been removed. A detailed breakdown of changes by domain is available in Table 3.2 of the technical report.
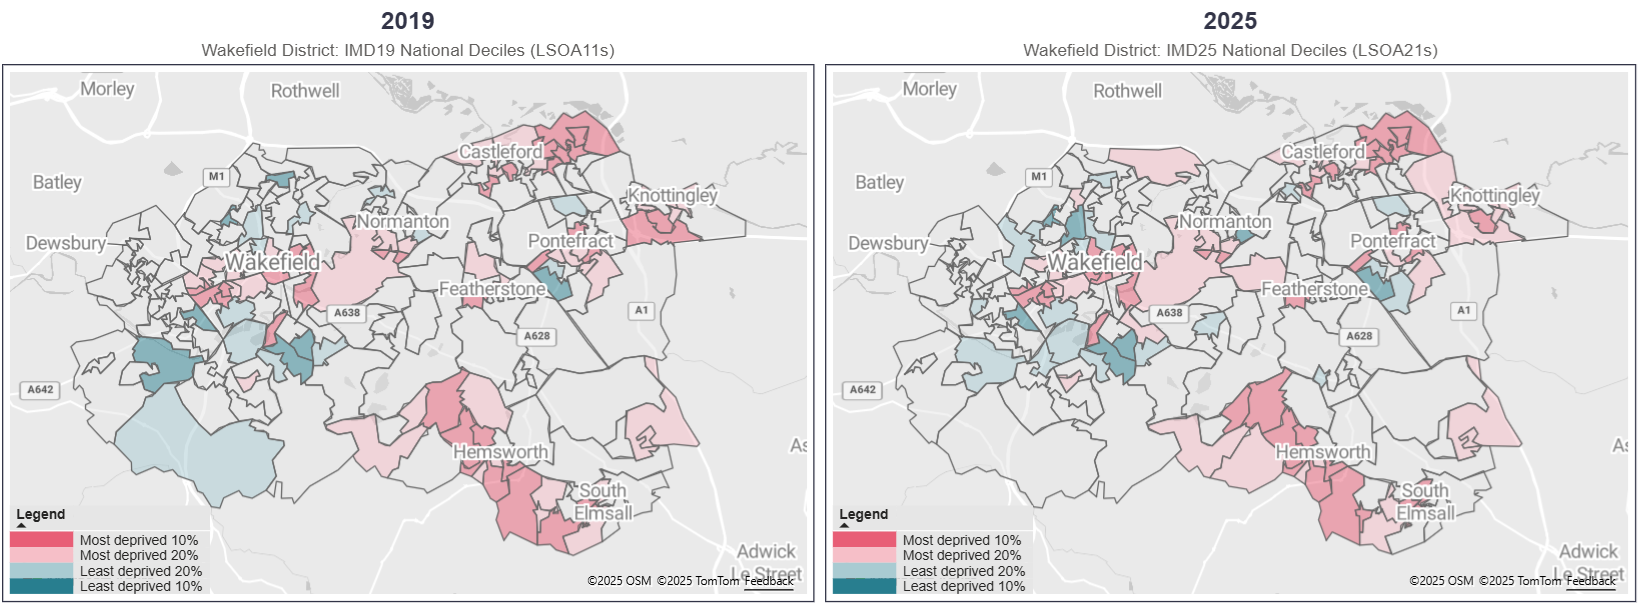
That being said, the overall picture for Wakefield remains similar to the IoD19, as shown in the maps below, which highlight the areas that are amongst the 20% most and least deprived areas in the country.
32 LSOAs in Wakefield District have remained in the most deprived 10% nationally between IMD19 and IMD25.
How do areas within Wakefield differ?
There is variation in the level of deprivation within the Wakefield District, with pockets of deprived and less deprived areas. The picture for Wakefield also changes between the different domains. None of the least deprived 10% areas for the ‘Health Deprivation and Disability’ domain are within the Wakefield District.
Use the interactive dashboard below to explore the most and least deprived 20% areas of the district, for the different domains and the overall IMD25 at both a local and national level.
What does deprivation look like for different age groups within Wakefield?
20.2% of children aged 0-17 in Wakefield live in areas that are among the most deprived 10% nationally, compared to 13.4% of adults aged 65+.
Use the interactive dashboard below to explore how the populations differ across the IMD deciles. Use the buttons above the chart on the right to switch between the age groups.