
Published: July 2023
There were 3,067 births to Wakefield resident mothers in 2022/2023.
Headlines
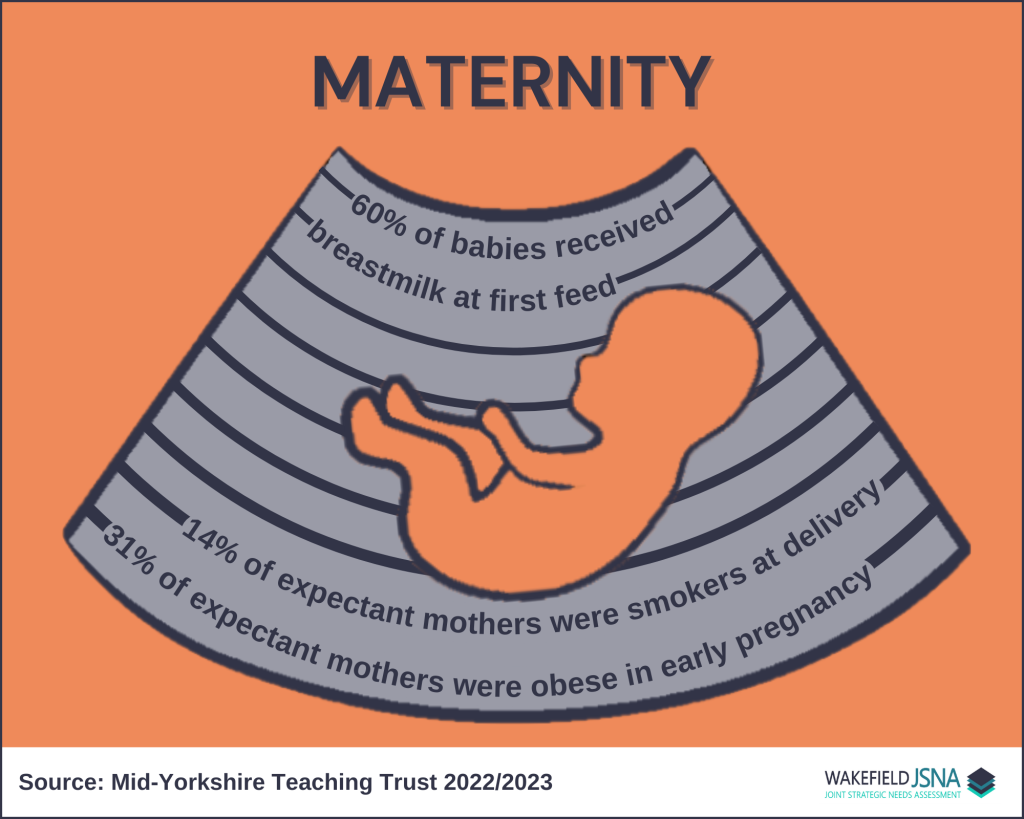
- Obesity in early pregnancy is on the rise, from 26.2% in 2019/20 to 30.6% in 2022/23.
- Smoking in early pregnancy has decreased, from 23.1% in 2013/14 to 16.0% in 2022/23.
- Smoking at delivery has also decreased, from 22.0% in 2013/14 to 14.2% in 2022/23.
- Young people are less likely to be living with obesity in early pregnancy, compared to older age groups.
- Young people are more likely to smoke at delivery, compared to older age groups.
- Women living in the most deprived areas are less likely to breastfeed for the first feed compared to women living in the least deprived areas.
- Compared to the England average, Wakefield district has…
- significantly higher proportions of smoking in early pregnancy and at delivery.
- significantly higher proportions of obesity in early pregnancy.
- significantly higher proportions of teenage mothers.
- significantly lower levels of breastfeeding.
How does Wakefield district compare…
This section contains the latest nationally published data from the OHID Fingertips – Child and Maternal Health profile. Compared to the England average, Wakefield district has…
nationally?
This section contains maternity data for patients booking and delivering at Mid-Yorkshire Teaching Trust (MYTT). This information can be used to look at the needs of patients (and their babies) who have used MYTT; it cannot be used to assess the needs of the general population, as those who have used a different provider are not included. The interactive dashboard below can be used to explore the trends in maternity data over the recent years. Click on the buttons at the bottom to navigate between the different measures.
in recent years?
What are the differences within Wakefield district?
This section contains maternity data for patients booking and delivering at Mid-Yorkshire Teaching Trust (MYTT). This information can be used to look at the needs of patients (and their babies) who have used MYTT; it cannot be used to assess the needs of the general population, as those who have used a different provider are not included. The interactive dashboard below can be used to explore the inequalities in maternity data over the recent years. Click on the buttons at the bottom to navigate between the different measures. Use the filters section at the top to explore the different inequalities and periods. The chart and map are colour coded showing the comparison against the district average figure.
maternal inequalities