
Headlines
- From a peak in 2020, there has been a decreasing in the rate of referrals to Children’s Social Care (per 10,000 population) in the last 3 years and the Wakefield rate is lower than its comparators.
- In 20203, there was a further reduction in the rate of children in need which has decreased over the last 3 years.
- There was a higher there percentage of boys assessed as children in need compared with girls and and the vast majority of children were White British.
- The most common reason by far for children to be assessed a child in need in 2023 was abuse or neglect.
- Rates for attainment for children in need at Key Stage 2 in Reading, Writing and Maths were lower in 2023 compared with 2022, however these were favourable for Writing and Maths when compared with other similar local authority areas. For attainment at Key Stage 4, the attainment in 2023 remained very similar to 2022 and this was slightly better than the national rate and other similar LA areas.
- Unauthorised absence for children in need increased in 2023 which mirrors the trend in absence seen nationally.
The term “Child in Need” (CIN) is defined in national guidance as “a child who is unlikely to achieve or maintain a reasonable level of health or development, or whose health and development is likely to be significantly or further impaired, without the provision of services, or a child who is disabled” (section 17, Children Act 1989).
The following summary of data relating to children in need in Wakefield provides population level information about the cohort and how this compares with rates in England along with the group of Local Authorities in England who are deemed to be similar to Wakefield in terms of aspects of the population, known as statistical neighbours. The data is published annually by the Department of Education (DfE) based on the financial year to 31st March and is collected through the CIN Census which is submitted by all Local Authorities in England. Where it has been found that data for children in need in Wakefield varies significantly from statistical neighbours or where there is an increasing or decreasing trend over time, then some recommendations are made and commentary is provided on how this is being addressed.
1. The Population
Wakefield has a responsibility to ensure that children living in the area area safe and supported to stay well and healthy. Everyday members of the public as well as services such as Police, Health, Schools, voluntary organisations and many others report concerns about the welfare and/or safety of children and young people living in the area to Wakefield Council’s Children’s Social Care Service. The central point for receiving concerns is the Integrated Front Door (IFD) and when a concern is received, this is recorded as a contact. In 2022 the Wakefield IFD received 20,287 contacts, a significant increase compared with 2023 when 15,919 concerns were received. The nature of the concerns is reviewed by the IFD to determine whether there is potential harm or risk for a child and when these are significant, this is passed as a referral to Children’s Social Care (statutory service) who then undertake an assessment of the situation for the child, young person and their family.
If it decided that an assessment is not required, a referral might be made to the Targeted Early Help Service (non statutory service) or the Family & Youth Hubs to provide Early Help support or the child, young person or family may be signposted to other services and sources of support within the Wakefield District such as Health Services or community based support groups. Information and advice may also be given to the person or service contacting the IFD on any steps they can take to support the child or family.
When an assessment has been completed by Children’s Social Care a decision will be reached on whether there is a level of need and vulnerability for a child or young person or where there is potential harm or risk for a child which requires intervention by statutory Social Care services. If intervention is agreed then a child may be supported as a Child in Need (CIN) and a CIN plan would be developed by the allocated Social Worker.
Children who have a level of need may also receive from other services such as Health Services (eg Health Visitors or Speech Therapists) School or Nursery staff or voluntary sector organisations in addition to Social Care. Where significant harm or risk has been identified, a child may become subject to a Child Protection plan which means a higher level of intervention and some may at be at such serious or immediate risk that they require to be cared for by the Local Authority. For more information on children with a Child Protection plan and Children in Care, please see the Child Protection and Children in Care pages on this website.
It is known that for children who suffer neglect or harm or are abused physically, emotionally, sexually there can be immediate and long term effects for children and young people including:
- Increased risk of mental health issues
- Difficulties forming and maintaining relationships
- Lower attainment rate than that of peers
- Increased likelihood of anti social behaviour and offending
- Difficulties sustaining employment
- Challenges in developing attitudes and skills necessary for effective parenting.
There are likely to be a range of issues which result in a child or young person being identified as a child in need such as parenting issues, domestic abuse, sexual abuse and exploitation, mental health issues, substance misuse or disability. These are known collectively as adverse childhood experiences (ACEs) and there is growing research which evidences the negative consequences and impact of a cluster of ACEs on life chances as the child reaches adolescence and then adulthood. To prevent and minimise the impact for children and young people support is provided by Children’s Social Care to reduce risks and promote improvement in a child’s health, development and wellbeing and ensure they can flourish and achieve their potential.
There has been a decreasing trend in the rate of referrals to Children’s Social Care (per 10,000 population) which had risen to a peak in 2020. In 2023, there was a rate (per 10,000 population) of 595.10 which was a reduction from 603.30 in 2022. The 2023 rate was lower than the statistical neighbour rate of 660.72 although higher than the national rate of 544.50. This shows that a lower level of concerns received regarding children and young people in Wakefield, were deemed to need statutory intervention than in similar local authorities in England. This may be because more children and families are receiving support at the early intervention level and have not escalated to the level requiring Children’s Social Care intervention. The table below shows the rate of referrals over the last 6 years, there has been a significant reduction in the referral rate since 2020.
Table 1 – Rate of Referrals to Children’s Social Care (per 10,000 population)
| 2019 | 2020 | 2021 | 2022 | 2023 | |
| Wakefield | 820.00 | 1017.10 | 706.30 | 603.30 | 595.10 |
| Statistical Neighbours | 607.79 | 695.15 | 625.01 | 639.97 | 660.72 |
| National | 544.50 | 534.80 | 494.30 | 552.90 | 544.50 |
The DFE definition of CIN includes all children and young people receiving a statutory service for Children’s Social Care and so published CIN numbers include those on a CIN plan, those on a Child Protection plan, Children in Care and also those who have left care and are still eligible for support.
Since 2021, there has been an decreasing trend in the rate of CIN (per 10k population) and this has reduced from from 345.80 in 2022 to 323.60 in 2023. This is a contrast to the national rate, which has seen a steady increase from 2021, however has remained lower than the Wakefield rate, with a rate of 544.50 in 2023. Furthermore, the CIN rate for Wakefield has been below our statistical neighbours for 2022 and 2023. The reducing CIN rate mirrors the decrease in referrals in table 1 and although there has been a decrease in the overall CIN rate since 2021, there has been a small increase in the number of children with a Child Protection plan between 2021 and 2023. Please see the Child Protection page on this website for more information.
Table 2 – Rate of Children in Need (per 10,000 population)
| 2019 | 2020 | 2021 | 2022 | 2023 | |
| Wakefield | 439.70 | 410.00 | 360.50 | 345.80 | 323.60 |
| Statistical Neighbours | 430.31 | 546.66 | 430.58 | 458.13 | 428.80 |
| National | 334.20 | 323.70 | 321.20 | 343.80 | 342.70 |
Figure 1 – Rate of Children in Need (per 10,000 population)
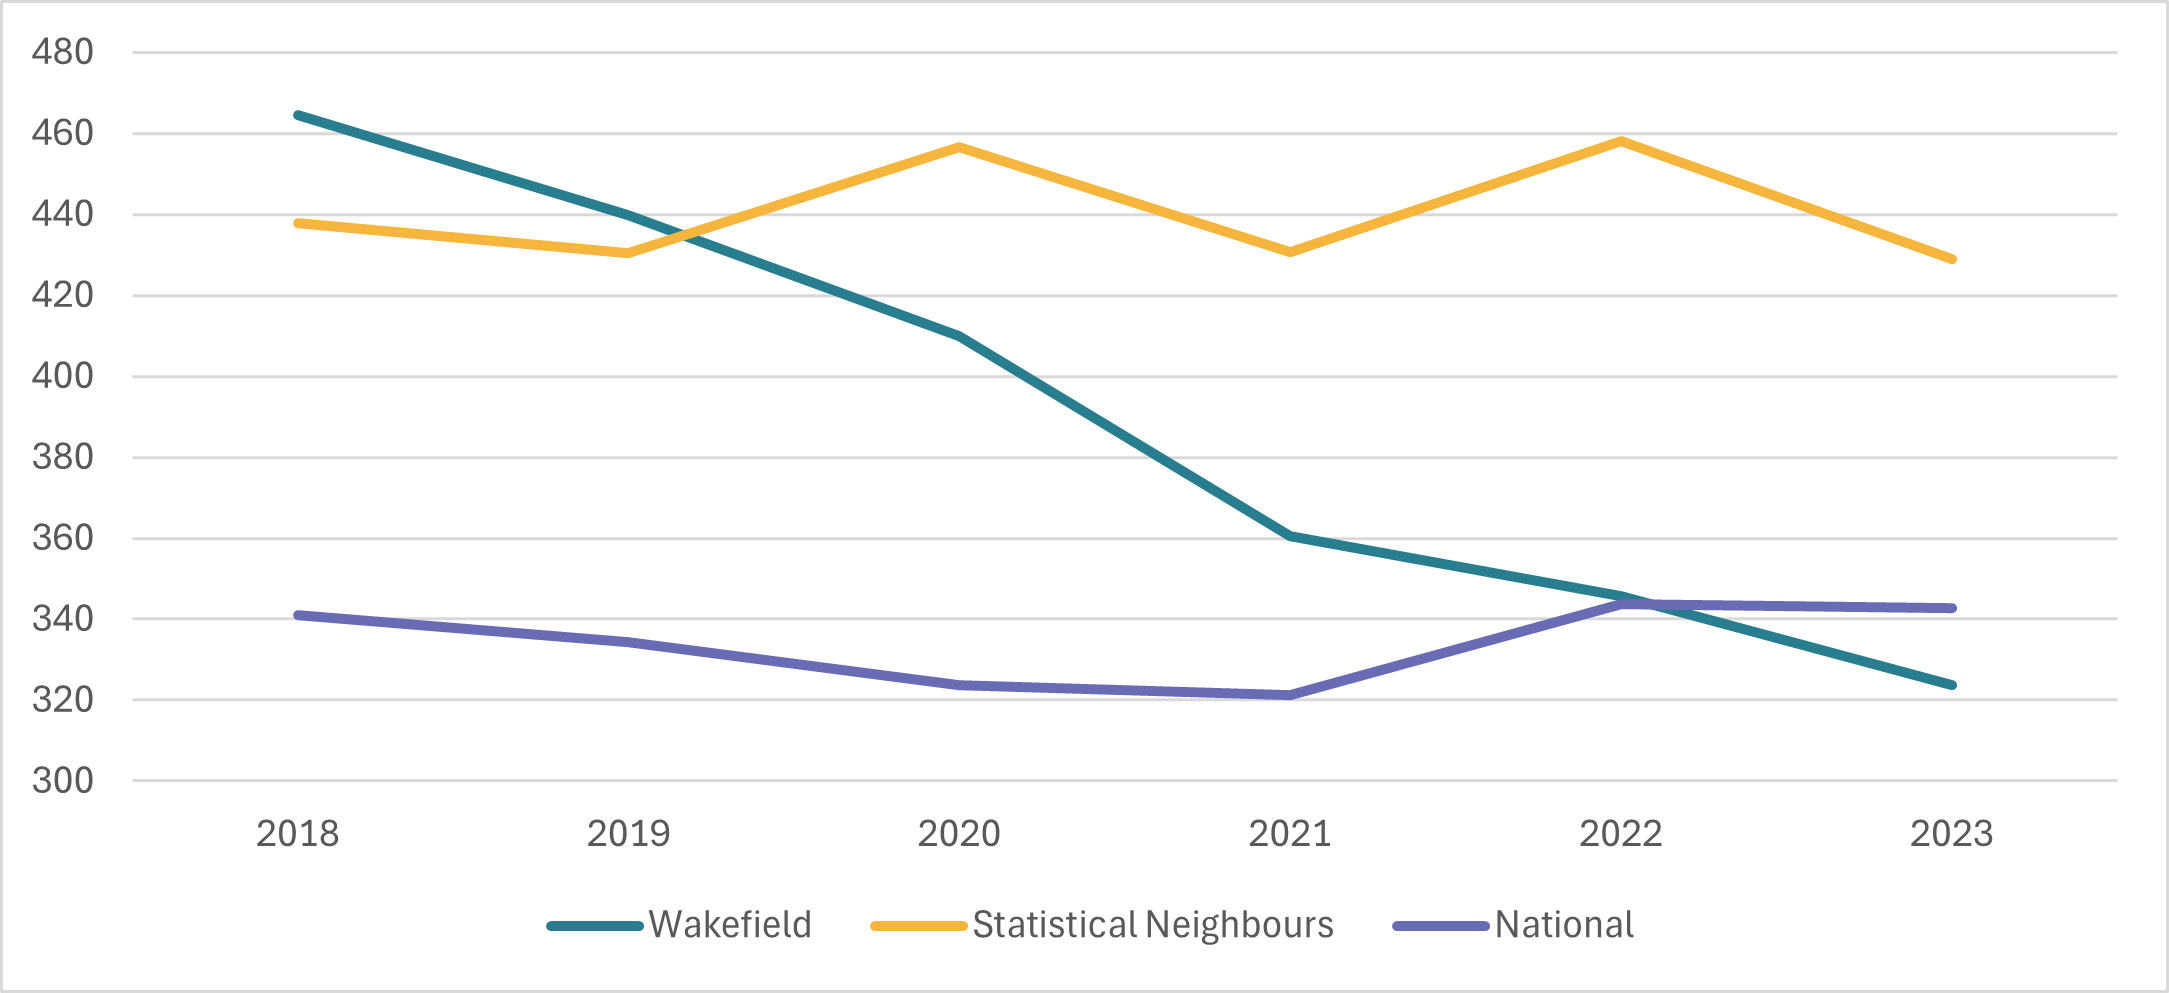
The figure above visualises the rate decline for Wakefield compared to the statistical neighbour and national rate.
The charts below provide further detail on children in need in Wakefield. For each chart, a different year can be selected through and other filters.
It is important that when additional support is required that children receive this at the earliest possible stage to prevent issues escalating to a significant level and to minimise the longer term impact on children. Children can be supported through a range of services such as Schools, Health Services and Voluntary Sector Services. An example might be a child accessing some group work support at school or a parent attending a parenting programme in the community. In Wakefield, early intervention support is provided by the Children First Hubs, please see the Early Help pages on this website for information and data on children and families accessing the service.
To further improve the early intervention approach, in 2020, the Wakefield the Wakefield Families Together programme was launched with services including Children’s Social Care Teams and Children First Hub Teams and partner organisations such as Health and Police co-locating within multi agency teams in a cluster model based around schools so they are closer to where children and families live.
Where schools have concerns about a child and feel they may need additional support, Team Around the School meetings enable multi agency discussions to agree who is best placed to provide this support. The aim is that this will maximise early intervention and reduce over time the level of need for statutory intervention.
Table 3a – Length of time for children with CIN plan in 2022
| Wakefield | Stat Neighbours | National | |
| Under 3 Months | 29.60% | 27.62% | 27.40% |
| 3-6 Months | 14.10% | 12.38% | 11.50% |
| 6 Months – 1 Year | 15.70% | 14.75% | 13.50% |
| 1-2 Years | 11.70% | 14.25% | 13.40% |
| Over 2 Years | 28.90% | 31.00% | 34.20% |
Table 3b – Length of time for children with CIN plan in 2023
| Wakefield | Stat Neighbours | National | |
| Under 3 Months | 25.80% | 26.16% | 26.80% |
| 3-6 Months | 13.00% | 11.24% | 10.60% |
| 6 Months – 1 Year | 16.40% | 14.87% | 13.50% |
| 1-2 Years | 15.90% | 15.62% | 14.80% |
| Over 2 Years | 28.90% | 32.11% | 34.30% |
In situations when it is agreed that a CIN plan is required for a child or young person, this will take some time for effective change to be achieved, which is outlined in the trends of the above tables.
In 2022, 29.60% of children and young people had been on a CIN plan for less than 3 months, a relatively short period of time. This was slightly higher than the statistical neighbour and national rate. The percentage with a plan between 3-6 months and 6 months – 1 year was also consistent but marginally higher than the statistical neighbours and the national rate. In Wakefield in 2022, 28.9% of children had a CIN plan longer than 2 years, which was very similar to the rate for statistical neighbours. The table shows the full breakdown.
For 2023, 25.8% of children and young people had been on a CIN plan for less than 3 months, lower than the 2022 rate. This figure was lower than the statistical neighbours and the national rate. The percentage with a plan been 3-6 months and 6 months – 1 year was slightly lower than the 2022 rate but slightly higher than the statistical neighbour and national rate. In 2023, the rate of children and young adults that had a CIN plan for longer than 2 years was the same figure as in 2022, 28.9% and again lower than the statistical neighbour and national rate. This may suggest that issues have been addressed and positive outcomes have been achieved in a shorter period than in other similar local authorities.
2. Challenges
It is known that outcomes for children in need can be poorer than for those who do not require this level of support and some children in need may need extra support at school and may be assessed as having special educational needs support (SEN) or may require an Education, Health & Care Plan (EHCP). Children with these additional needs may not achieve a similar level of attainment in school as their peers who do not require support. The table below shows the percentage of children in need who had SEN support in school over the last 4 years.
Table 4 – % of School Age CIN with SEN Support
| 2020 | 2021 | 2022 | 2023 | |
| Wakefield | 21.00% | 19.40% | 19.00% | 24.90% |
| Statistical Neighbours | 21.34% | 21.73% | 22.51% | 23.48% |
| National | 21.60% | 20.70% | 21.30% | 21.80% |
Following a slow decrease in percentage between 2020 and 2022, the percentage of school age children in need with SEN support increased in 2023 to 24.9% for Wakefield. The 2023 rate is slightly higher than the statistical neighbour rate as well as the national rate. The 2023 increase could be seen positively with more children being identified and who may therefore receive additional support. Increases have also been seen in the statistical neighbour and national rate during the same period.
Table 5 – % of School Age CIN with a SEN Statement/EHCP
| 2020 | 2021 | 2022 | 2023 | |
| Wakefield | 19.30% | 19.70% | 18.70% | 20.10% |
| Statistical Neighbours | 20.99% | 22.60% | 20.44% | 22.99% |
| National | 25.60% | 26.90% | 26.10% | 28.20% |
The number of active EHCPs for all children has continued to increase in Wakefield, mirroring the trend which has been seen nationally. The percentage of children who are CIN with an EHCP has increased over the last 6 years. This increased to 28.2% for Wakefield in 2023, which was again higher than the statistical neighbour rate (22.99%) and the national rate (18.7%). This outlines the improvements of identifying children and young people with needs that can be met with the EHCP to support them, as opposed to being referred to Children’s Social Care.
Table 6 – % of Children in Need achieving expected standard Key Stage 2 in Reading, Writing & Maths
| Reading | Writing | Maths | |||||||
| 2021 | 2022 | 2023 | 2021 | 2022 | 2023 | 2021 | 2022 | 2023 | |
| Wakefield | 55.00% | 44.00% | 45.00% | 44.00% | 47.00% | 44.00% | |||
| Statistical Neighbours | 49.30% | 47.10% | 41.10% | 43.40% | 43.70% | 45.80% | |||
| National | 45.00% | 43.00% | 38.00% | 39.00% | 39.00% | 39.00% | |||
Due to the Coronavirus pandemic, no data is available for 2021.
Comparing the last 2 years of attainment data, for children in need in Wakefield at Key Stage 2, a lower percentage achieved the expected standard in Reading, Writing and Maths in 2023 than in 2022, although in reading and writing the rates remained ahead of the statistical neighbour and national rates. For reading the rate decreased in to 44%, which fell behind the statistical neighbour percentage (47.1%) but remained ahead of the national percentage (43%). For Writing in 2023 there was a slight decrease to 44%, although this remained ahead of the statistical neighbours (43.4%) and national percentage (39%). For Maths the % of CIN achieving expected standard reduced to 44%, down 3% from 2022. The 2023 figure has fallen behind the statistical neighbour rate (45.8%) but remained ahead of the national rate (39%).
It is known that the Covid-19 pandemic has had an impact on attainment which may be evidenced in this data. Children who were CIN were still able to attend schools during the lockdown periods, but it is likely there has been an impact on their educational development.
In terms of attainment at the secondary school level, average progress scores aim to capture the progress pupils make from the end of Primary School to the end of Secondary School.
Pupils’ results are compared to the actual achievements of other pupils with similar prior attainment. A score of 0 means pupils on average do as well as those with similar prior attainment nationally. A positive score means pupils on average do better and a negative school means pupils on average do worse, although this does not mean that pupils did not make progress rather they made less progress than other pupils nationally.
Table 7 – Average Progress 8 Score at Key Stage 4 for Children in Need
| 2021 | 2022 | 2023 | |
| Wakefield | -1.50 | -1.47 | |
| Statistical Neighbours | -1.70 | -1.58 | |
| National | -1.62 | -1.59 |
Due to the Coronavirus Pandemic, there is no data available for 2021.
In terms of attainment at the secondary school level, average progress scores aim to capture the progress pupils make from the end of Primary School to the end of Secondary School. Pupils’ results are compared to the actual achievements of other pupils with similar prior attainment. A score of 0 means pupils on average do as well as those with similar prior attainment nationally. A positive score means pupils on average do better and a negative school means pupils on average do worse. Although this does not mean that pupils did not make progress, rather they made less progress than other pupils nationally.
The table above shows that the overall progress 8 score remained almost the same in 2023 as in 2022. The rate of -1.47 seen in 2023 was slightly better than the statistical Neighbour and national 2023 rate. This means that Wakefield CIN did slightly better than those in other similar Local Authorities at Key Stage 4 in 2023 compared with their peers. As the scores are negative in both 2022 and 2023, the cohort did not do as well as their peers and this is an area for attention.
Due to schools being closed to the majority of pupils during 2020 and 2021 the lockdown for the Covid-19 pandemic, children with CIN were still able to attend although it likely these children will still have missed sessions due to self isolation requirements and other factors and the full impact of this may not be known for some time.
Table 8 – % School age children in need who missed sessions through unauthorised absence – 3 terms
| 2021 | 2022 | 2023 | |
| Wakefield | 4.40% | 7.10% | 8.10% |
| Statistical Neighbours | 5.01% | 7.89% | 9.07% |
| National | 4.30% | 6.90% | 8.20% |
Minimising absence is important to ensure that children achieve their full potential at school. For children in need in Wakefield, the percentage of CIN who have missed sessions through unauthorised absence had remained fairly consistent until 2022 when a considerable increase from 4.4% to 7.1% was seen. Despite this increase the Wakefield rate for 2022 remained behind the statistical neighbour rate (7.89%), but was above the national Rate (6.9%) where there had also been a significant increase in the rates. In 2023, there was a further increase and the Wakefield rate (8.1%) was lower than both statistical neighbour (9.07%) and national rate (8.2%). Since the Covid-19 pandemic, there has been a decrease nationally in school attendance rates and increased absence. In Wakefield, a new attendance strategy was launched in 2023, with an action plan to drive an increase in attendance for all children with an increased focus on supporting the most vulnerable children to achieve a high level of attendance at school.
3. Key Findings & Recommendations
Having considered the key messages from the data the following recommendations have been identified:
- There has been a decreasing trend in the rate of referrals and the rate of children in need over the last 3 years and the latest rates are lower than statistical neighbours but higher than the national rate. This may evidence the strength of work with partners and the strong Early Help offer including the Wakefield Families Together approach and Targeted Early Help Service which has been developed over this period to support families at an earlier stage. Reporting for Early Help activity evidences a significantly increasing trend for families accessing the Family and Youth Hubs and the Team Around the Schools approach enables multi agency discussions on now best to support children before the statutory level
- The data shows in Wakefield children in need may do less well at school in comparison with statistical neighbours both at Key Stage 2. The recommendation is to explore reasons for lower rates of attainment for children in need and to work with the Education & Inclusion Service and Schools to consider how the cohort of children can be further supported.
4. How are children in need supported?
Continuum of Need
In Wakefield, services for children, young people and their families are described within the Continuum of Need. This has been developed through the Wakefield Safeguarding Children Partnership working with other agencies such as Health, Police and voluntary organisations and is consistent with Working Together to Safeguard Children (2023). It describes the level of support available for children and young people depending on their level of need from services which are available universally and for all such as dentists, GPs and schools through to services for children and young people with significant and complex needs. The aim is that children and young people will receive support at the earliest possible stage when required to prevent issues from becoming more serious. Support may be provided through the Wakefield Families Together approach, having early discussions about the right place for support for families which can be delivered through Family & Youth Hubs, Targeted Early Help, Health Visitors, Community Based Groups and others. When the issues being experienced by a child or young person are more complex and there are risks and harm which requires statutory intervention then a referral may be made to Children’s Social Care which is assessed by the IFD.
Integrated Front Door
The IFD which is often also known as the “Front Door” receives all concerns about children and young people either from members of the public or from other services such as Police, Schools, Health and voluntary sector services. In many cases, concerns are made by phone but they can also be made by email or a referral form can be submitted. The IFD Team is made up of Social Workers who review the information they receive and screen this along with information they may already know about children, young people and their families, if anything. Some Police, Health and Education staff are also based within the IFD Team and where appropriate Social Workers may ask if any information is held by these partners about children and young people which informs the decision making process. Concerns relating to domestic abuse are considered separately, medium risk are triaged by Police and Social Care and high risk cases are considered at the Domestic Risk Assessment Meeting. All concerns need to be triaged within one working day from receiving the concern. Where there are significant concerns, a referral is made to the Children’s Social Care Teams to undertake an assessment of the child’s situation. Where it is deemed there is not significant risk then a referral may be made to a non statutory service such as Early Help or other universal service eg Health Visiting. Feedback is provided to the person who raised the concern about the outcome and Social Workers also regularly provide advice to individuals and professionals on particular situations involving children and young people where a referral to Children’s Social Care is not appropriate. Where there is significant risk, the IFD Team will also undertake the Child Protection function, calling partners to a multi agency meeting called a Strategy Discussion to consider if immediate action is required to reduce the immediate risk for a child.
Children’s Social Care
For children and young people who have been assessed as having significant needs eg suffering significant neglect, suffering sexual abuse, being impacted by parental issues etc they will receive support at level 4 of the continuum of need and will receive support from a Social Worker. In some situations a child or young person may have received support at an earlier stage eg level 2 or 3 but this may not have been successful in resolving issues or reducing risks.
Support for children and young people in need is provided through Social Work teams, although it is likely that children and young people will receive other types of support eg attending a group work programme through the Children First Hubs, accessing emotional health support or having respite care. Some of this support may be delivered by partner agencies such as Health and Schools. For children in need, a care plan will be developed by Children’s Social Care which will detail what interventions are required to improve outcomes for children and this will be maintained and reviewed during the period the child or young person is receiving support. The child or young person will be visited on a frequent basis (as a minimum every 6 weeks) who will work with the child and their family to make positive changes to address issues and reduce risks of harm. Within the Children’s Social Care Service there is also a specific Children Vulnerable to Exploitation Team which works to reduce risks for children who go missing as well as those at risk of exploitation such as sexual exploitation and criminal exploitation. Whilst the child or young person continues on a CIN plan, there will be a multi agency meeting held every 6 weeks to consider what progress is being made and if where appropriate whether other actions need to be taken. If there is not enough change over a period of time or the risk for the child or young person increases then child protection processes will be implemented. When it is decided there has been significant change and that this can be sustained, then the plan will be ended although it is likely the child or young person and their family will be referred non statutory services to help them maintain the positive changes.
Wakefield Families Together
With the aim of supporting children and families to resolve issues at the earliest possible stage, Wakefield Families Together is an approach which has been in place since 2020. The approach includes a network of Family & Youth Hubs where a team of professionals work together to identify and offer early help and support along with Team Around meetings where concerns can be discussed with a support plan agreed where appropriate. Multi agency Teams work across 6 cluster areas in Wakefield and they are focused around schools with regular meetings with schools to discuss cases where families may require additional support. More information is found below. In addition the Targeted Early Help Service work to support families with a higher level of need, but those who do not meet the level for referral to Children’s Social Care. The Service will agree a plan of support with a family to improve outcomes
Wakefield Families Together – Wakefield Families Together