
Published: April 2024
Headlines
- The National Child Measurement Programme (NCMP) is a national scheme to improve the understanding of obesity trends in children in Reception (aged 4-5 years) and Year 6 (aged 10-11 years).
- In 2022/23 76% of children in Reception and 60% of children in Year 6 were of a healthy weight. This is similar to regional and national levels.
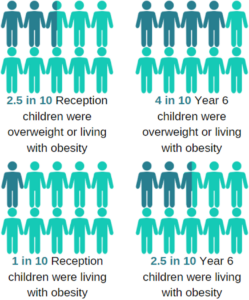
- In 2022/23 more children in year 6 were living with overweight or obesity (39%) than in Reception year (23%).
- In 2022/23 total percentages of underweight children were low in both Reception (1%) and Year 6 (2%).
- As seen nationally, changes related to the Covid pandemic and associated lockdown led to the percentage of children who were living with overweight and obesity in Wakefield increasing, this has now begun to decrease.
- In Wakefield in reception females are more likely to be living with overweight or obesity than males whereas in Year 6 boys are more likely to be (2022/23).
- In Wakefield children were more likely to be living with overweight or obesity in the most deprived areas of the district (2022/23).
- In Wakefield the percentage of children living with overweight or obesity was similar across children of different ethnic groups (2022/23).
- Following children between Reception and Year 6 most children who were a healthy weight in Reception (84.9% of all), 73.6% stayed a healthy weight in Year 6 (Reception: 2013/14-2016/17 to Year 6: 2019/20-2022/23).
- Following children between Reception and Year 6 most children who were living with obesity in Reception (5.3% of all) 83.0% were still living with obesity in Year 6 (Reception: 2013/14-2016/17 to Year 6: 2019/20-2022/23).
Introduction
The National Child Measurement Programme (NCMP) is a UK Government scheme established to help improve understanding of obesity prevalence and trends in children. It collects data on the height and weight of school children in Year Reception (aged 4-5 years) and Year 6 (aged 10-11 years) each academic year. The scheme was set up in 2006 in line with the Government’s strategy to tackle obesity and inform local planning and service delivery for children. Each child’s body mass index (BMI) is calculated which combines both height and weight measurements to give a score. These measurements can then be categorised as underweight, healthy weight, overweight or obese based on cut-offs adjusted for a child’s age.
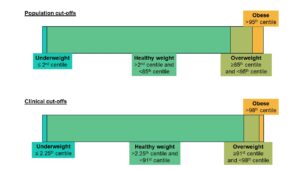
The NCMP uses the population monitoring cut offs of the British 1990 (UK1990) growth reference data to define the BMI categories. The population monitoring cut offs for overweight and obesity are lower than the clinical cut offs (clinical cut-offs: 91st centile for overweight and 98th centile for obesity) used to assess individual children; this is to capture children in the population in the clinical overweight or obesity BMI categories and those who are at high risk of moving into the clinical overweight or clinical obesity categories. The population cut offs are based on the assumption that around 15% of the baseline population were overweight, and 5% were living with obesity in 1990. Underweight is calculated based on a BMI lower than the second centile. This approach is recommended by the National Institute for Health and Care Excellence (NICE). This helps ensure that adequate services are planned and delivered for the whole population.
NCMP Data Dashboard
The dashboard below gives interactive data on the NCMP measurements for Wakefield district:
How does Wakefield District compare…
Reception Year 6 Children in reception are more likely to be a healthy weight in Reception and the percentage of children who are overweight or living with obesity is higher in Year 6. Infographic of NCMP Findings
Currently (2022/23)?
Recent trends suggest most measures relating to weight are relatively stable across Wakefield apart from the percentage of children with a healthy weight in Year 6 is decreasing (getting worse) and percentage of children living with obesity in Year 6 is increasing (getting worse). Figures nationally and locally have been recently affected by the Covid pandemic where the percentage of children living with overweight and obesity increased due to several factors relating to the pandemic including children spending more time at home, closure of children’s activities and sports and disruption to the NCMP itself in some regions, though the measurement programme in Wakefield was not badly affected. Recent results suggest that weight measurements in Reception have returned to pre-pandemic levels but levels of overweight and obesity in Year 6 are still slightly higher than those seen in 2019/20. Childhood obesity can continue into adulthood (see Wakefield JSNA page describing adult obesity in the District here ). Obesity is associated with increased risk for a number of health conditions in both childhood and into adulthood including asthma, cardiovascular disease, type 2 diabetes, depression and some types of cancer (Jebeile, 2022). Research has suggested if the cohort of children in year 6 during the Covid pandemic continues to have higher levels of excess weight it could nationally cost up to £800 million pounds due to the cost of healthcare (Ochoa-Moreno, 2024)
Recent trends
A national report explored the relationship between an individual child’s weight measurement in Reception (2013-2014) and the later in Year 6 (2019-2020) [1]. A similar analysis was carried out for Wakefield but combining four years of data for children in Reception in 2013/14 – 2016/17 and Year 6 in 2019/20 – 2022/23. Due to these data tracking individual children the clinical cutoffs for weight categories were used as were used in the national report (these are different to the population cutoffs normally reported for the NCMP data-sets and lead to slightly less children being categorised as overweight or obese): These trends were similar to those found in the national analysis.
Changes between reception and Year 6 in the same group of children
What are the differences across Wakefield District?
In Reception girls were more likely to be overweight or living with obesity than boys (girls: 24.9%, boys: 22.1%), but boys were more likely to be than girls in Year 6 (girls: 36.9%, boys:40.3%). Three year averages for the percentage of children in each weight category were calculated for the 27 neighbourhoods of Wakefield and variation was seen across the District (see interactive map in the dashboard for a more detailed breakdown).
Currently (2022/23)?
Deprivation was measured for the area each child lived in using the Index of Multiple Deprivation (IMD), this was then split into quintiles (5 equal sized groups). In reception levels of overweight and living with obesity were similar across the deprivation quintiles but by Year 6 children from areas in the most deprived quintile of Wakefield District were more likely to be overweight or obese and those in the least deprived were less likely (most deprived: 44.5%, least deprived: 29.6%, District average: 38.7%).
In reception children of Asian or Asian British ethnicity were less likely to be overweight or living with obesity (Asian or Asian British: 10.6%, District average: 23.5%), in Year 6 percentages were similar across all ethnic groups.
Changes between reception and Year 6 in the same group of children
Resources and Support
Growing Healthy App Wakefield 0-19 Service
A new free app has been launched to support the health development and wellbeing of children, young people and their families in Wakefield District. The app provides information including videos on a wide range of topics such as antenatal care; infant feeding, diet and nutrition, child development; perinatal, infant and child emotional health; children with special educational needs; and making sure your child is ready for school, find more information here .
NHS Information about the National Child Measurement (NCMP) program and support for parents
This NHS page gives further information about the NCMP and help and advice for parents if their child is measured to be a healthy weight, overweight or needs to gain weight, the link is here .
Aspire Health referral junior 5 to 17 years
For Wakefield district families paying Council Tax to Wakefield Council and who have a child/children aged between 5-17 years (Up to 25 years with a learning disability) who are above the 91st centile for weight can receive extra support to help their child improve their overall health and well-being. The programme helps with setting goals that are realistic and achievable, making dietary and lifestyle changes and focusing on the long-term. Referral to the program can be made here
Wakefield Families Together Healthy Eating for Babies and Toddlers
Wakefield Families Together gives some links to resources for feeding babies and todders here
References
Jebeile H, Kelly AS, O’Malley G, Baur LA. Obesity in children and adolescents: epidemiology, causes, assessment, and management. Lancet Diabetes Endocrinol. 2022 May;10(5):351-365 https://www.thelancet.com/journals/landia/article/PIIS2213-8587(22)00047-X/fulltext .
NHS England (2023) National Child measurement programme – 2022/23 school year results https://digital.nhs.uk/data-and-information/publications/statistical/national-child-measurement-programme/2022-23-school-year
Ochoa-Moreno I, Taheem R, Woods-Townsend K, Chase D, Godfrey KM, Modi N, Hanson M. Projected health and economic effects of the increase in childhood obesity during the COVID-19 pandemic in England: The potential cost of inaction. PLoS One. 2024 Jan 24;19(1):e0296013. https://journals.plos.org/plosone/article?id=10.1371/journal.pone.0296013
Office for Health Improvement and Disparities (OHID) (2022) National child measurement programme (NCMP): changes in the prevalence of child obesity between 2019 to 2020 and 2021 to 2022:
https://www.gov.uk/government/statistics/national-child-measurement-programme-ncmp-changes-in-the-prevalence-of-child-obesity-between-2019-to-2020-and-2021-to-2022
Office for Health Improvement and Disparities (OHID) (2024) Fingertips – NCMP Obesity Profile – NCMP analysis reports: https://fingertips.phe.org.uk/profile/national-child-measurement-programme/supporting-information/contents/
Office for Health Improvement and Disparities (OHID) (2024) Fingertips – NCMP Obesity Profile – Wakefield District values: https://fingertips.phe.org.uk/profile/national-child-measurement-programme/data#page/1/gid/8000011/pat/15/par/E92000001/ati/502/are/E08000036/iid/90316/age/200/sex/4/cat/-1/ctp/-1/yrr/1/cid/4/tbm/1